Making the Halifax sidewalk snow clearing map people want
Feb 23, 2025
It snows in Halifax!
The city clears some sidewalks themselves and contracts out clearing of others.
If you want to find out when a sidewalk will be cleared, you need to know or look at:
- Standards and timelines for sidewalk clearing (be sure you don’t look at street standards by mistake)
- Priority of the relevant sidewalk (again, be sure you don’t look at the street priorities map by mistake)
- Service updates for the “weather event end time”
For example, sidewalks on Bloomfield St on the Halifax Peninsula are priority 3. That means they should be cleared within 36 hours from the end of a weather event. If an event ends at 9 am, they should be cleared by 9 pm the next day.
These various sites and maps are not very mobile friendly. The map shows a notice every load.
Juggling all the necessary information while moving between sites and maps creates high cognitive load.
I wanted a map that would do all this for me. I was not alone.
Here’s how I made the map I and others wanted.
Sidewalks and priorities
To start, I needed data describing sidewalks and their clearing priorities. The city’s Active Travelways dataset has the needed info. Using Bloomfield St again, filtering the data shows that street’s sidewalks. Clicking on one includes “Winter Maintenance Level of Service” with a value of “Priority 3.”
The dataset is available for download in GeoJSON format and plotting GeoJSON data on a map is pretty straightforward with Leaflet.
Standards and timelines
The sidewalk clearing standards and timelines are pretty static. They are:
- Priority 1: cleared within 12 hours from end of an event
- Priority 2: cleared within 18 hours from end of an event
- Priority 3: cleared within 36 hours from end of an event
Getting these onto the map for each sidewalk would help. But the city’s map already does that.
What makes the city’s map less useful than it could be is that it doesn’t incorporate the event end time. You have to figure that out yourself, then do the math.
I wanted my map to know about event end times and be able to combine them with priorities. For example, for Bloomfield St sidewalks, it should be able to show a 9 pm clearing deadline.
Event end times
To get my map showing deadlines, it needed to know about event end times.
As far as I know, the only that information is available is the Service updates page.
Here’s what the relevant part looks like right now:
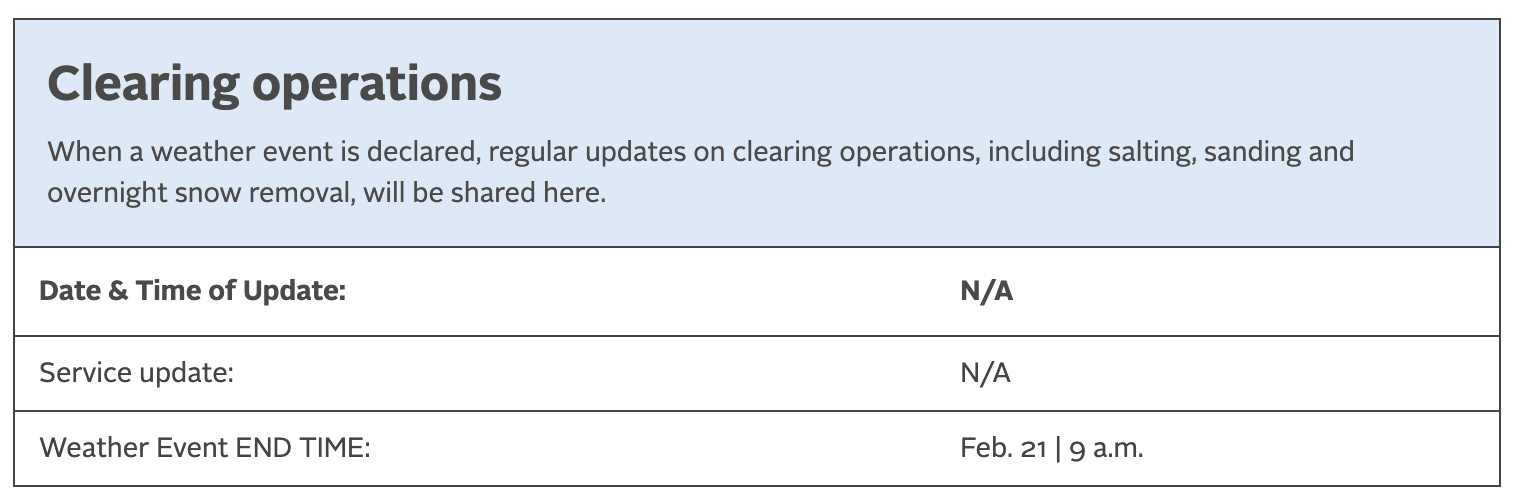
Clearing Operations
I needed to extract information from this page, structure it, and make it available for my map.
I had already gotten a head start on this. In February 2022, I developed scraperlite specifically to capture data from this page.
scraperlite is a command that takes a URL and descriptions of CSS selectors to grab from the URL’s contents and saves them to a SQLite database file.
Given enough time, I thought, I’d be able to figure out what all might appear in this table and make sense of it.
Here’s a sense of what the last few changes to the page looked like:
| Update Time | Service Update | End Time |
|---|---|---|
| Feb. 13 | 4 p.m. | Surfaces are snow covered and icy condit… | N/A |
| Feb. 14 | 7 a.m. | Icy conditions are present. Operations a… | Feb. 13 | 9:30 p.m. |
| N/A | N/A | N/A |
| Feb. 16 | 4 p.m. | Crews are applying salt across the regio… | N/A |
| Feb. 17 | 7 a.m. | Most main roads are clear. Crews are app… | N/A |
| Feb. 17 | 7 a.m. | Most main roads are clear. Crews are app… | Feb. 17 | 2 a.m. |
| Feb. 17 | 5 p.m. | Crews will continue to clear streets and… | Feb. 17 | 2 a.m. |
| Feb. 17 | 5 p.m. | Crews will continue to clear streets and… | N/A |
| N/A | N/A | N/A |
| N/A | N/A | Feb. 21 | 9 a.m. |
Looking at these changes over time I saw three states:
- Dormant:
N/Afor both Update Time and End Time, indicating a weather event is not active and did not end recently - Active: a value for Update Time but
N/Afor End Time, indicating a weather event is active but has not ended - Ended: a value in End Time, indicating a weather event has ended
I wrote something that read through the data saved by scraperlite to look at each change to the page and figured out what state things were in.
It also cleaned the dates and times which was a big part of making things work. This page is clearly maintained by hand and people find many different ways to write dates and times.
The map page specifically needed to know the current state and last observed End Time.
For example, if the state is Ended and the End Time is Feb 21 at 9 am, the map page can do the math to know a priority 3 sidewalk should be cleared by 9 pm the next day.
If the state is Active, it can indicate something is happening and the new End Time is not yet known.
The finished product
Bringing all this together, you can check out my map here.
Here’s what a Bloomfield St sidewalk looks like in my map:
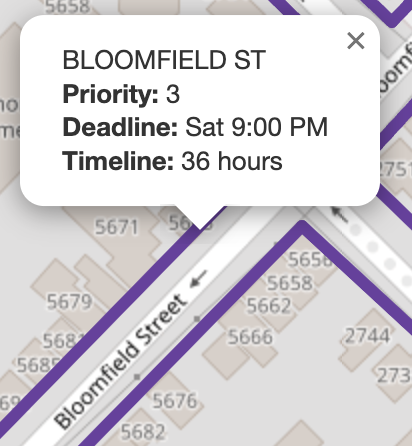
My map showing a Bloomfield St sidewalk
And the priorities and their deadlines are clear at the top:

My map’s priorities header
It’s mobile friendly and, I think, pretty snappy.
If you like, the source is available here. It includes the map HTML/javascript page, the program to process the Active Travelways dataset for use by the map, and the program to process the observations saved by scraperlite.
Appendix: Making the map faster
A goal along the way was to keep the map snappy. Here are some changes I made to make it faster.
At first, I did some processing on the Active Travelways GeoJSON data and produced a smaller GeoJSON file with just the info I needed. I limited the output to just the Halifax peninsula to keep rendering time down. Limiting also kept the GeoJSON smaller, but it was still over a MB.
To remove the peninsula limitation, I changed to a binary format from GeoJSON. The resulting file was smaller than the peninsula-limited GeoJSON but was able to contain all sidewalks with snow clearing priority in HRM. I changed the map page to process the binary format and add items to the map directly instead of using Leaflet’s GeoJSON helper. That made the data about 750 K.
Showing all HRM sidewalks meant the map started zoomed way out, so I changed it to save the last state. If you zoom in somewhere, close the page, then open it again, you’ll go back to the same view.
But loading time was still sluggish from loading and adding all sidewalks to the map, even if they weren’t shown. I experimented with only showing what was currently visible but that still took a lot of comparing of coordinates and such. I ended up changing the features file to have segments within to cut down on comparisons. The map page was changed to load segments’ features as the become visible.
Finally, I centralized popup generation so info about each sidewalk wouldn’t be duplicated in the loaded sidewalk data and the map’s internal data.
More could probably be done, such as using varints.